> ## Documentation Index
> Fetch the complete documentation index at: https://docs.mobula.io/llms.txt
> Use this file to discover all available pages before exploring further.
# Understanding Trade Fees - Complete Fee Breakdown
> Get the complete fee breakdown for DEX trades. Unlike Axiom, GMGN, Padre that only show gas fees, Mobula provides full analysis with gas, platform, and MEV fees.
# Complete Fee Breakdown for DEX Trades
**The Most Complete Fees Data in Web3** — Unlike trading terminals like Axiom, GMGN, Padre that only display gas fees and a basic sum, the Mobula API provides a **complete fee breakdown** with detailed gas, platform, and MEV analysis. Available via REST API and WebSocket streaming.
## Why Mobula's Fee Data is Different
Most trading platforms and aggregators only show you **partial fee information**:
**The problem**: When platforms only show gas fees + a total sum, you're missing critical information. The **total trading cost** is often **2-5x higher** than just gas fees when using aggregators. Mobula is the only API that breaks down **every single fee component**.
### What Makes Fee Analysis Essential
The **total fees** on a trade consists of multiple components:
* **Gas fees (`gasFeesUSD`)**: Network costs — usually the smallest part
* **Platform fees (`platformFeesUSD`)**: Aggregator/UI fees — often 0.5-1% of trade value
* **MEV fees (`mevFeesUSD`)**: Priority fees, Jito bundles, sandwich protection
**Available everywhere**: This fee data is available in the [REST API endpoints](/rest-api-reference/endpoint/token-trades) AND via [WebSocket real-time streaming](/indexing-stream/stream/websocket/wss-fast-trades). Track fees as trades happen in real-time!
***
## Axiom vs Mobula: Fee Comparison
Here's a side-by-side comparison showing why **complete fee data matters**:
***
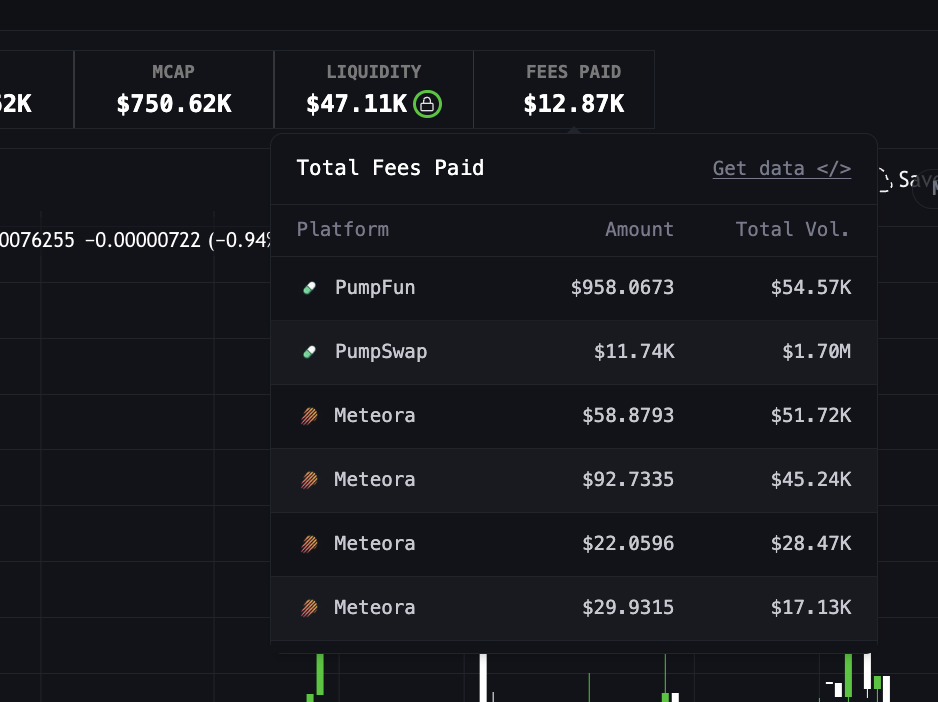
## Aggregated Fees by Token & Market
Beyond individual trade fees, Mobula provides **aggregated fee statistics** at both the **token level** and **market/pool level**.
 ### Token-Level Fees
Access cumulative fees across ALL markets for a token:
```json theme={null}
{
"data": {
"symbol": "EXAMPLE",
"totalFeesPaidUSD": 125000.50, // All-time total fees
"feesPaid24hUSD": 4450.0 // Last 24h fees
}
}
```
### Market-Level Fees
Each trading pool has its own fee statistics, letting you compare which pools are more "expensive" to trade:
```json theme={null}
{
"data": {
"pair": "EXAMPLE/SOL",
"address": "0x...",
"totalFeesPaidUSD": 45000.00, // Total fees on this pool
"feesPaid24hUSD": 1200.0
}
}
```
***
## Fees by Timeframe
Track **trading costs** across multiple timeframes to analyze patterns over time.
### Token-Level Fees
Access cumulative fees across ALL markets for a token:
```json theme={null}
{
"data": {
"symbol": "EXAMPLE",
"totalFeesPaidUSD": 125000.50, // All-time total fees
"feesPaid24hUSD": 4450.0 // Last 24h fees
}
}
```
### Market-Level Fees
Each trading pool has its own fee statistics, letting you compare which pools are more "expensive" to trade:
```json theme={null}
{
"data": {
"pair": "EXAMPLE/SOL",
"address": "0x...",
"totalFeesPaidUSD": 45000.00, // Total fees on this pool
"feesPaid24hUSD": 1200.0
}
}
```
***
## Fees by Timeframe
Track **trading costs** across multiple timeframes to analyze patterns over time.
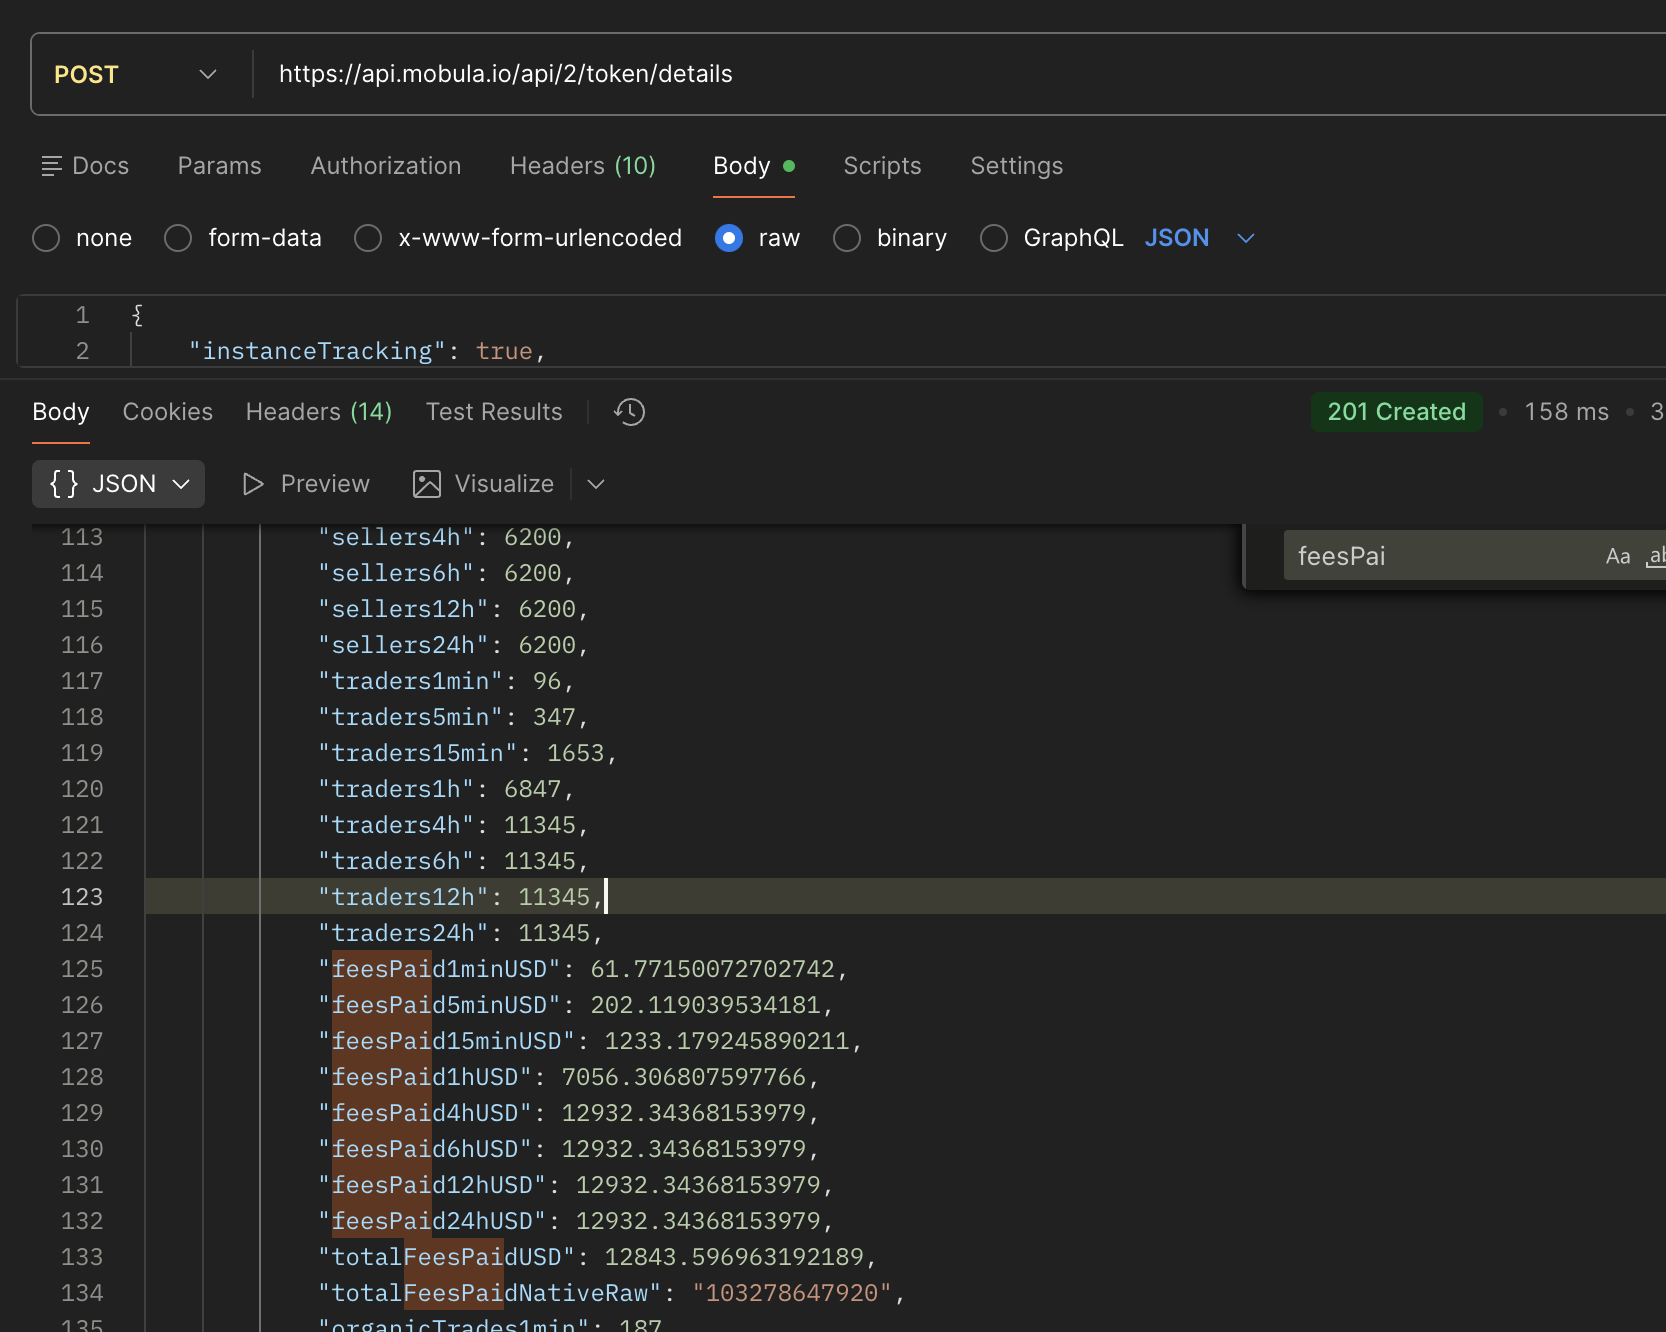 | Field | Timeframe |
| ------------------ | ------------------- |
| `feesPaid1minUSD` | Last 1 minute |
| `feesPaid5minUSD` | Last 5 minutes |
| `feesPaid15minUSD` | Last 15 minutes |
| `feesPaid1hUSD` | Last 1 hour |
| `feesPaid4hUSD` | Last 4 hours |
| `feesPaid6hUSD` | Last 6 hours |
| `feesPaid12hUSD` | Last 12 hours |
| `feesPaid24hUSD` | Last 24 hours |
| `totalFeesPaidUSD` | All-time cumulative |
***
## Why Trading Costs Matter
Understanding the complete **fee breakdown** is crucial for:
1. **Profitability analysis**: Calculate true P\&L including all costs
2. **Platform comparison**: Identify which aggregators charge more
3. **Strategy optimization**: Minimize fees for frequent traders
4. **Transparency**: Show users exactly where their money goes
***
## Fees as a Trending Token Indicator
**Pro insight**: Total fees paid is often the **best indicator for discovering trending tokens**. High fees indicate organic trading activity from serious traders willing to pay premium costs — not wash trading or bot manipulation.
Unlike volume which can be easily faked, **fees represent real money spent** by traders. Tokens with high `feesPaid24hUSD` or rapidly increasing `feesPaid1hUSD` are strong signals of genuine market interest.
### Access Trending Data via Pulse Endpoints
To get real-time access to tokens ranked by fees and other trending metrics, use the **Pulse** endpoints:
* **WebSocket**: Subscribe to the [Pulse Stream V2](/indexing-stream/stream/websocket/pulse-stream-v2) for real-time updates on trending tokens sorted by fees, volume, and other metrics
* **REST API**: Use the [POST /pulse](/rest-api-reference/endpoint/pulse-post) endpoint to query trending tokens with custom filters and sorting by fees
***
## Detailed Fees Breakdown
### Gas Fees (`gasFeesUSD`)
Gas fees are the fundamental cost of executing any blockchain transaction. They go directly to network validators/miners. This is the **only fee** that competitors like Axiom, GMGN, and Padre typically show individually.
**Why it matters**: Gas fees vary significantly based on network congestion. During peak times, a simple swap can cost $50+ on Ethereum mainnet, while the same trade might cost $0.001 on Solana.
### Platform Fees (`platformFeesUSD`)
Platform fees are charged by trading aggregators and frontend platforms. **This is the fee that competitors hide in their "total" sum.**
Most trading terminals (Axiom, GMGN, Padre, etc.) charge around **1%** per trade. Direct DEX access has **0%** platform fees — only swap fees apply.
Platform fees are often the **largest component** of trading costs, yet they're hidden by most platforms. On a $10,000 trade, a 1% platform fee means $100 — vs \$0.50 in gas fees!
### MEV Fees (`mevFeesUSD`)
MEV (Maximal Extractable Value) fees represent costs related to transaction priority and protection against front-running. Another fee component typically **hidden by competitors**.
**Types of MEV costs**:
* **Priority fees**: Extra tips to get faster inclusion
* **Jito bundles** (Solana): Fees for MEV protection
* **Flashbots** (EVM): Private transaction costs
***
## Fetching Fees with the API
### Single Trade Query
Retrieve detailed fee information for a specific transaction:
```bash theme={null}
curl -X GET "https://demo-api.mobula.io/api/2/token/trade?blockchain=solana&transactionHash=2qJM77u61uprkc9xo77nhksRiHV8VMyRoN1bu71tzZ8LKVE48vRx7bjWmB3WV9ufhSD9NjgH1t61nhPt6hy1MdQY" \
-H "Authorization: YOUR_API_KEY"
```
**Response**:
```json theme={null}
{
"data": {
"id": "123456789",
"type": "buy",
"baseTokenAmount": 1000000,
"baseTokenAmountUSD": 2500.00,
"quoteTokenAmount": 10.5,
"quoteTokenAmountUSD": 2500.00,
"transactionHash": "2qJM77u61uprkc9xo77nhksRiHV8VMyRoN1bu71tzZ8LKVE48vRx7bjWmB3WV9ufhSD9NjgH1t61nhPt6hy1MdQY",
"blockchain": "Solana",
"totalFeesUSD": 12.85,
"gasFeesUSD": 0.35,
"platformFeesUSD": 10.00,
"mevFeesUSD": 2.50
}
}
```
### Multiple Trades Query
Fetch trades with fees for Fartcoin:
```bash theme={null}
curl -X GET "https://demo-api.mobula.io/api/2/token/trades?blockchain=solana&address=9BB6NFEcjBCtnNLFko2FqVQBq8HHM13kCyYcdQbgpump&mode=asset&limit=50" \
-H "Authorization: YOUR_API_KEY"
```
Fetch trades for Wojak:
```bash theme={null}
curl -X GET "https://demo-api.mobula.io/api/2/token/trades?blockchain=solana&address=8J69rbLTzWWgUJziFY8jeu5tDwEPBwUz4pKBMr5rpump&mode=asset&limit=50" \
-H "Authorization: YOUR_API_KEY"
```
***
## Real-World Case Study: Analyzing a Solana Memecoin Trade
Let's analyze a real trade scenario on a Solana memecoin to understand how fees impact profitability.
### Breaking Down the Costs
| Component | Amount (USD) |
| ----------------------- | ------------ |
| Trade Value | \$2,500.00 |
| Gas Fee | \$0.35 |
| Platform Fee (Axiom 1%) | \$25.00 |
| MEV/Priority Fee | \$2.50 |
| **Total Fees** | **\$27.85** |
### Impact Analysis
```
Entry Cost: $2,500.00 + $27.85 = $2,527.85
Effective Entry Price: $0.00252785 per token
To break even, the token needs to increase by:
($27.85 / $2,500) × 100 = 1.11%
```
For small trades, platform fees can represent 1-2% of the trade value. For frequent traders or large positions, consider using direct DEX interfaces to minimize platform fees.
***
## API Reference
### REST API Endpoints
* [Token Details Endpoint](/rest-api-reference/endpoint/token-details) - Aggregated fees by timeframe (`feesPaid*USD`, `totalFeesPaidUSD`)
* [Token Trades Endpoint](/rest-api-reference/endpoint/token-trades) - Fetch multiple trades with per-trade fee breakdown
* [Token Trade Endpoint](/rest-api-reference/endpoint/token-trade) - Fetch single trade details with fees
* [Market Trades Pair](/rest-api-reference/endpoint/market-trades-pair) - Legacy trades endpoint with fee data
### WebSocket Streaming
* [Fast Trades WebSocket](/indexing-stream/stream/websocket/wss-fast-trades) - Real-time trade stream with fee breakdown as trades happen
***
## Summary
Understanding and tracking trade fees is essential for:
✅ Accurate P\&L calculations
✅ Platform comparison and optimization\
✅ Building transparent trading interfaces
✅ Helping users minimize trading costs
The Mobula API provides comprehensive fee breakdown data (`totalFeesUSD`, `gasFeesUSD`, `platformFeesUSD`, `mevFeesUSD`) that enables you to build powerful analytics and trading tools.
Generate your free API key and start analyzing trade fees today.
| Field | Timeframe |
| ------------------ | ------------------- |
| `feesPaid1minUSD` | Last 1 minute |
| `feesPaid5minUSD` | Last 5 minutes |
| `feesPaid15minUSD` | Last 15 minutes |
| `feesPaid1hUSD` | Last 1 hour |
| `feesPaid4hUSD` | Last 4 hours |
| `feesPaid6hUSD` | Last 6 hours |
| `feesPaid12hUSD` | Last 12 hours |
| `feesPaid24hUSD` | Last 24 hours |
| `totalFeesPaidUSD` | All-time cumulative |
***
## Why Trading Costs Matter
Understanding the complete **fee breakdown** is crucial for:
1. **Profitability analysis**: Calculate true P\&L including all costs
2. **Platform comparison**: Identify which aggregators charge more
3. **Strategy optimization**: Minimize fees for frequent traders
4. **Transparency**: Show users exactly where their money goes
***
## Fees as a Trending Token Indicator
**Pro insight**: Total fees paid is often the **best indicator for discovering trending tokens**. High fees indicate organic trading activity from serious traders willing to pay premium costs — not wash trading or bot manipulation.
Unlike volume which can be easily faked, **fees represent real money spent** by traders. Tokens with high `feesPaid24hUSD` or rapidly increasing `feesPaid1hUSD` are strong signals of genuine market interest.
### Access Trending Data via Pulse Endpoints
To get real-time access to tokens ranked by fees and other trending metrics, use the **Pulse** endpoints:
* **WebSocket**: Subscribe to the [Pulse Stream V2](/indexing-stream/stream/websocket/pulse-stream-v2) for real-time updates on trending tokens sorted by fees, volume, and other metrics
* **REST API**: Use the [POST /pulse](/rest-api-reference/endpoint/pulse-post) endpoint to query trending tokens with custom filters and sorting by fees
***
## Detailed Fees Breakdown
### Gas Fees (`gasFeesUSD`)
Gas fees are the fundamental cost of executing any blockchain transaction. They go directly to network validators/miners. This is the **only fee** that competitors like Axiom, GMGN, and Padre typically show individually.
**Why it matters**: Gas fees vary significantly based on network congestion. During peak times, a simple swap can cost $50+ on Ethereum mainnet, while the same trade might cost $0.001 on Solana.
### Platform Fees (`platformFeesUSD`)
Platform fees are charged by trading aggregators and frontend platforms. **This is the fee that competitors hide in their "total" sum.**
Most trading terminals (Axiom, GMGN, Padre, etc.) charge around **1%** per trade. Direct DEX access has **0%** platform fees — only swap fees apply.
Platform fees are often the **largest component** of trading costs, yet they're hidden by most platforms. On a $10,000 trade, a 1% platform fee means $100 — vs \$0.50 in gas fees!
### MEV Fees (`mevFeesUSD`)
MEV (Maximal Extractable Value) fees represent costs related to transaction priority and protection against front-running. Another fee component typically **hidden by competitors**.
**Types of MEV costs**:
* **Priority fees**: Extra tips to get faster inclusion
* **Jito bundles** (Solana): Fees for MEV protection
* **Flashbots** (EVM): Private transaction costs
***
## Fetching Fees with the API
### Single Trade Query
Retrieve detailed fee information for a specific transaction:
```bash theme={null}
curl -X GET "https://demo-api.mobula.io/api/2/token/trade?blockchain=solana&transactionHash=2qJM77u61uprkc9xo77nhksRiHV8VMyRoN1bu71tzZ8LKVE48vRx7bjWmB3WV9ufhSD9NjgH1t61nhPt6hy1MdQY" \
-H "Authorization: YOUR_API_KEY"
```
**Response**:
```json theme={null}
{
"data": {
"id": "123456789",
"type": "buy",
"baseTokenAmount": 1000000,
"baseTokenAmountUSD": 2500.00,
"quoteTokenAmount": 10.5,
"quoteTokenAmountUSD": 2500.00,
"transactionHash": "2qJM77u61uprkc9xo77nhksRiHV8VMyRoN1bu71tzZ8LKVE48vRx7bjWmB3WV9ufhSD9NjgH1t61nhPt6hy1MdQY",
"blockchain": "Solana",
"totalFeesUSD": 12.85,
"gasFeesUSD": 0.35,
"platformFeesUSD": 10.00,
"mevFeesUSD": 2.50
}
}
```
### Multiple Trades Query
Fetch trades with fees for Fartcoin:
```bash theme={null}
curl -X GET "https://demo-api.mobula.io/api/2/token/trades?blockchain=solana&address=9BB6NFEcjBCtnNLFko2FqVQBq8HHM13kCyYcdQbgpump&mode=asset&limit=50" \
-H "Authorization: YOUR_API_KEY"
```
Fetch trades for Wojak:
```bash theme={null}
curl -X GET "https://demo-api.mobula.io/api/2/token/trades?blockchain=solana&address=8J69rbLTzWWgUJziFY8jeu5tDwEPBwUz4pKBMr5rpump&mode=asset&limit=50" \
-H "Authorization: YOUR_API_KEY"
```
***
## Real-World Case Study: Analyzing a Solana Memecoin Trade
Let's analyze a real trade scenario on a Solana memecoin to understand how fees impact profitability.
### Breaking Down the Costs
| Component | Amount (USD) |
| ----------------------- | ------------ |
| Trade Value | \$2,500.00 |
| Gas Fee | \$0.35 |
| Platform Fee (Axiom 1%) | \$25.00 |
| MEV/Priority Fee | \$2.50 |
| **Total Fees** | **\$27.85** |
### Impact Analysis
```
Entry Cost: $2,500.00 + $27.85 = $2,527.85
Effective Entry Price: $0.00252785 per token
To break even, the token needs to increase by:
($27.85 / $2,500) × 100 = 1.11%
```
For small trades, platform fees can represent 1-2% of the trade value. For frequent traders or large positions, consider using direct DEX interfaces to minimize platform fees.
***
## API Reference
### REST API Endpoints
* [Token Details Endpoint](/rest-api-reference/endpoint/token-details) - Aggregated fees by timeframe (`feesPaid*USD`, `totalFeesPaidUSD`)
* [Token Trades Endpoint](/rest-api-reference/endpoint/token-trades) - Fetch multiple trades with per-trade fee breakdown
* [Token Trade Endpoint](/rest-api-reference/endpoint/token-trade) - Fetch single trade details with fees
* [Market Trades Pair](/rest-api-reference/endpoint/market-trades-pair) - Legacy trades endpoint with fee data
### WebSocket Streaming
* [Fast Trades WebSocket](/indexing-stream/stream/websocket/wss-fast-trades) - Real-time trade stream with fee breakdown as trades happen
***
## Summary
Understanding and tracking trade fees is essential for:
✅ Accurate P\&L calculations
✅ Platform comparison and optimization\
✅ Building transparent trading interfaces
✅ Helping users minimize trading costs
The Mobula API provides comprehensive fee breakdown data (`totalFeesUSD`, `gasFeesUSD`, `platformFeesUSD`, `mevFeesUSD`) that enables you to build powerful analytics and trading tools.
Generate your free API key and start analyzing trade fees today.