Complete Fee Breakdown for DEX Trades
The Most Complete Fees Data in Web3 — Unlike trading terminals like Axiom, GMGN, Padre that only display gas fees and a basic sum, the Mobula API provides a complete fee breakdown with detailed gas, platform, and MEV analysis. Available via REST API and WebSocket streaming.
Why Mobula’s Fee Data is Different
Most trading platforms and aggregators only show you partial fee information:What Makes Fee Analysis Essential
The total fees on a trade consists of multiple components:- Gas fees (
gasFeesUSD): Network costs — usually the smallest part - Platform fees (
platformFeesUSD): Aggregator/UI fees — often 0.5-1% of trade value - MEV fees (
mevFeesUSD): Priority fees, Jito bundles, sandwich protection
See the complete fee breakdown with hover tooltip in the Mobula Trading Terminal
Available everywhere: This fee data is available in the REST API endpoints AND via WebSocket real-time streaming. Track fees as trades happen in real-time!
Axiom vs Mobula: Fee Comparison
Here’s a side-by-side comparison showing why complete fee data matters:Comparing fee display: Axiom shows only gas + sum, Mobula shows the complete breakdown
Aggregated Fees by Token & Market
Beyond individual trade fees, Mobula provides aggregated fee statistics at both the token level and market/pool level.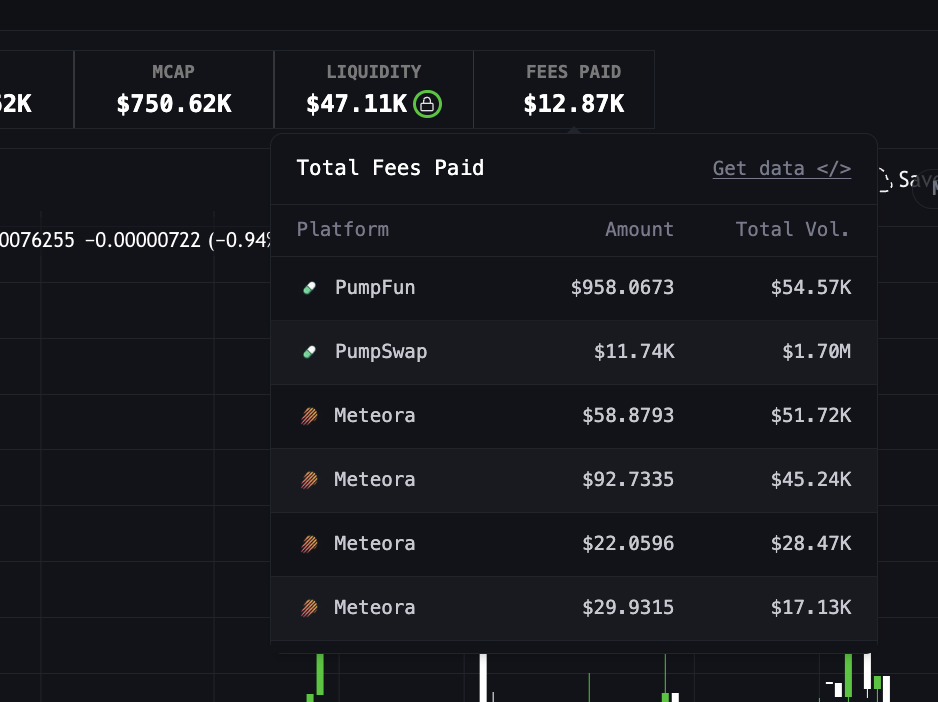
Total fees displayed at both token level and individual market/pool level
Token-Level Fees
Access cumulative fees across ALL markets for a token:Market-Level Fees
Each trading pool has its own fee statistics, letting you compare which pools are more “expensive” to trade:Fees by Timeframe
Track trading costs across multiple timeframes to analyze patterns over time.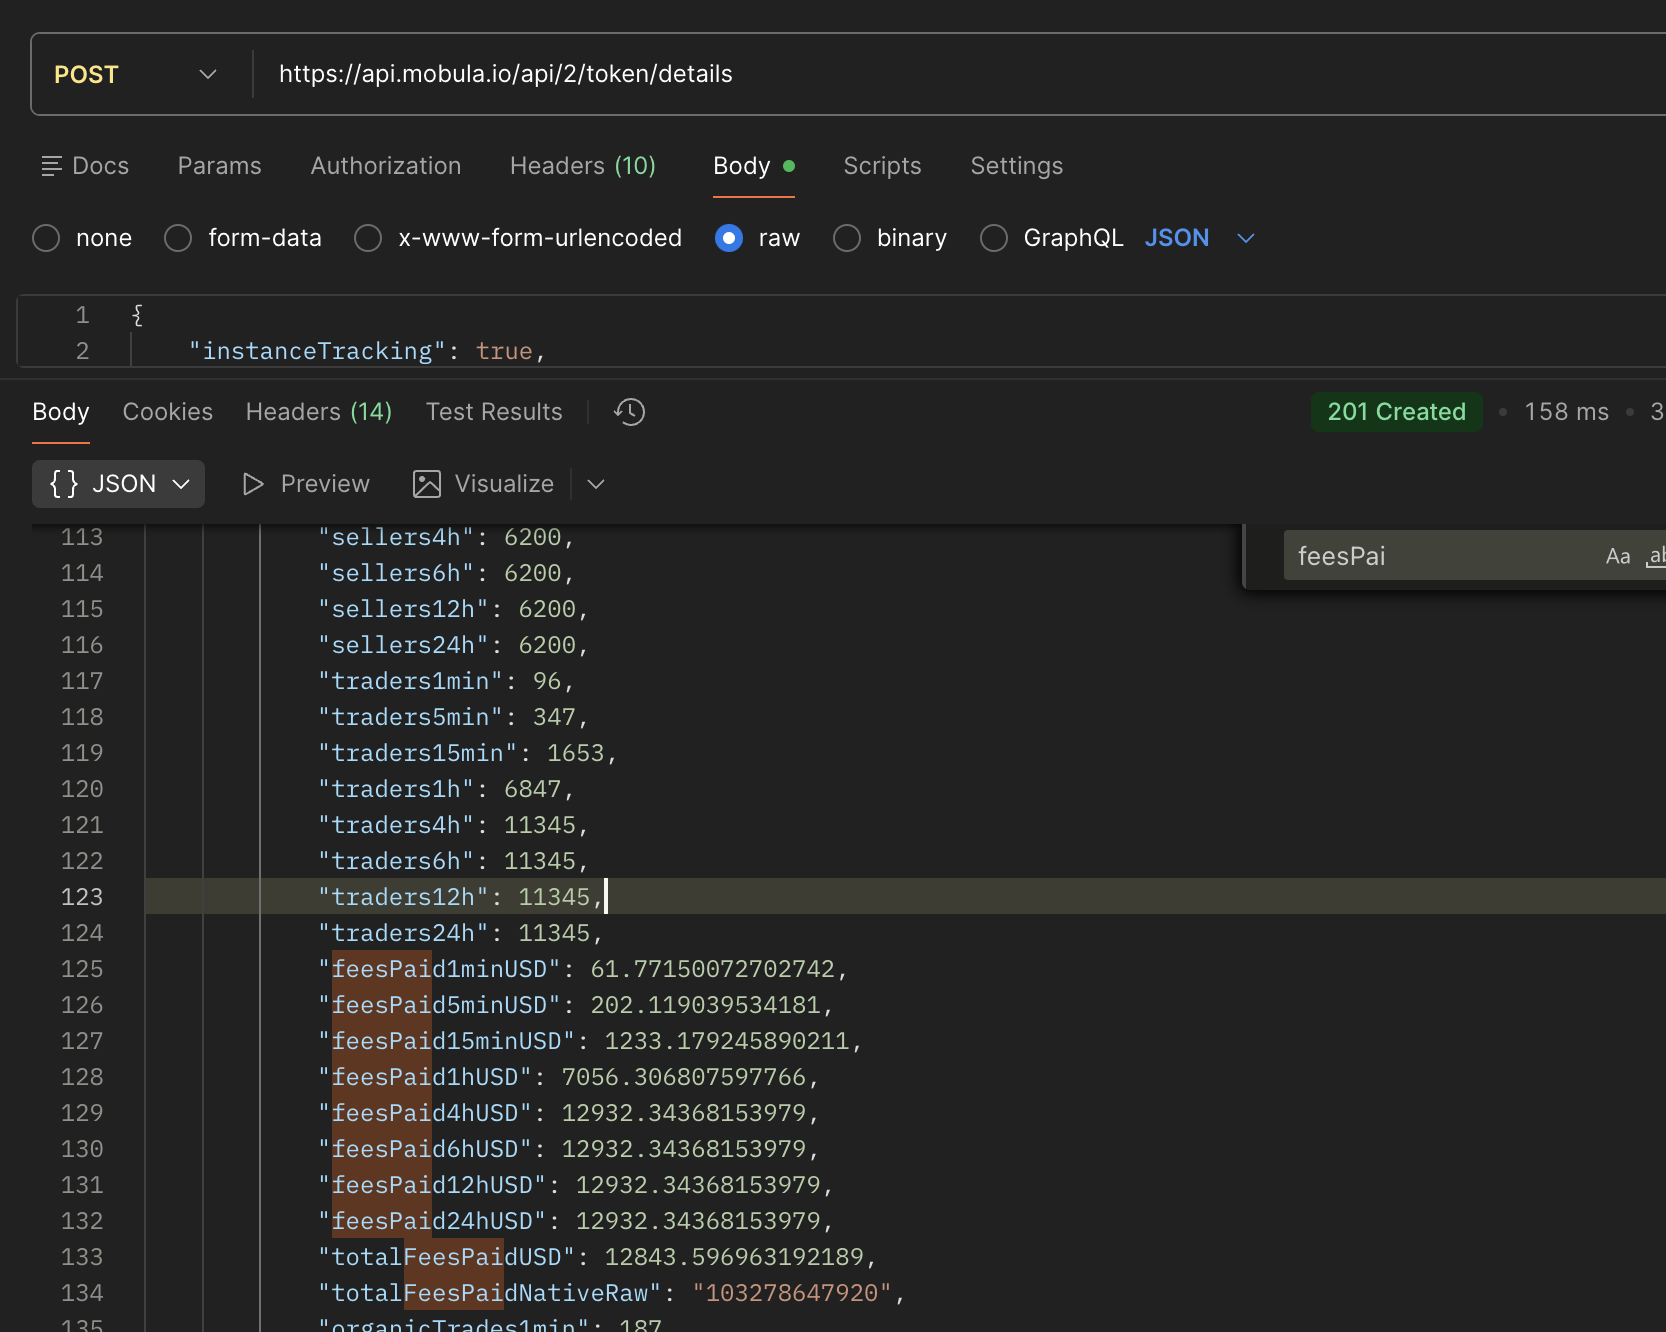
Postman response showing fees by timeframe (1min, 5min, 15min, 1h, 4h, 24h)
Why Trading Costs Matter
Understanding the complete fee breakdown is crucial for:- Profitability analysis: Calculate true P&L including all costs
- Platform comparison: Identify which aggregators charge more
- Strategy optimization: Minimize fees for frequent traders
- Transparency: Show users exactly where their money goes
Fees as a Trending Token Indicator
Unlike volume which can be easily faked, fees represent real money spent by traders. Tokens with highfeesPaid24hUSD or rapidly increasing feesPaid1hUSD are strong signals of genuine market interest.
Access Trending Data via Pulse Endpoints
To get real-time access to tokens ranked by fees and other trending metrics, use the Pulse endpoints:- WebSocket: Subscribe to the Pulse Stream V2 for real-time updates on trending tokens sorted by fees, volume, and other metrics
- REST API: Use the POST /pulse endpoint to query trending tokens with custom filters and sorting by fees
Detailed Fees Breakdown
Gas Fees (gasFeesUSD)
Gas fees are the fundamental cost of executing any blockchain transaction. They go directly to network validators/miners. This is the only fee that competitors like Axiom, GMGN, and Padre typically show individually.
Why it matters: Gas fees vary significantly based on network congestion. During peak times, a simple swap can cost 0.001 on Solana.
Platform Fees (platformFeesUSD)
Platform fees are charged by trading aggregators and frontend platforms. This is the fee that competitors hide in their “total” sum.
Most trading terminals (Axiom, GMGN, Padre, etc.) charge around 1% per trade. Direct DEX access has 0% platform fees — only swap fees apply.
MEV Fees (mevFeesUSD)
MEV (Maximal Extractable Value) fees represent costs related to transaction priority and protection against front-running. Another fee component typically hidden by competitors.
Types of MEV costs:
- Priority fees: Extra tips to get faster inclusion
- Jito bundles (Solana): Fees for MEV protection
- Flashbots (EVM): Private transaction costs
Fetching Fees with the API
Single Trade Query
Retrieve detailed fee information for a specific transaction:Multiple Trades Query
Fetch trades with fees for Fartcoin:Real-World Case Study: Analyzing a Solana Memecoin Trade
Let’s analyze a real trade scenario on a Solana memecoin to understand how fees impact profitability.Breaking Down the Costs
Impact Analysis
API Reference
REST API Endpoints
- Token Details Endpoint - Aggregated fees by timeframe (
feesPaid*USD,totalFeesPaidUSD) - Token Trades Endpoint - Fetch multiple trades with per-trade fee breakdown
- Token Trade Endpoint - Fetch single trade details with fees
- Market Trades Pair - Legacy trades endpoint with fee data
WebSocket Streaming
- Fast Trades WebSocket - Real-time trade stream with fee breakdown as trades happen
Summary
Understanding and tracking trade fees is essential for: ✅ Accurate P&L calculations ✅ Platform comparison and optimization✅ Building transparent trading interfaces ✅ Helping users minimize trading costs The Mobula API provides comprehensive fee breakdown data (
totalFeesUSD, gasFeesUSD, platformFeesUSD, mevFeesUSD) that enables you to build powerful analytics and trading tools.
Ready to get started?
Generate your free API key and start analyzing trade fees today.